|
Exploration & description/Importance of cattle

 The histograms show the data still to be skewed slightly to the right but nevertheless more normal than those for the untransformed data (histogram shown
earlier under Livestock species owned). The histograms show the data still to be skewed slightly to the right but nevertheless more normal than those for the untransformed data (histogram shown
earlier under Livestock species owned).
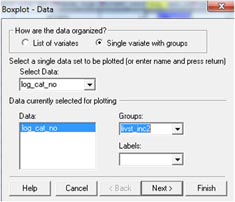
To investigate further the distribution of cattle numbers on the logarithmic scale we can generate a box-plot via Graphics → Boxplot...and complete the dialog box as shown
below. The three outliers at the top all correspond to homesteads for which livestock provided the primary source of income, namely rows 85, 405 and 437 in
CS11Data1.
 These data points may need further scrutiny, such as checking the questionnaires to verify that the numbers of cattle have been correctly entered. There are also a few homesteads with many fewer cattle (one or two) than the average. These data points may need further scrutiny, such as checking the questionnaires to verify that the numbers of cattle have been correctly entered. There are also a few homesteads with many fewer cattle (one or two) than the average.
|

 The histograms show the data still to be skewed slightly to the right but nevertheless more normal than those for the untransformed data (histogram shown
earlier under
  These data points may need further scrutiny, such as checking the questionnaires to verify that the numbers of cattle have been correctly entered. There are also a few homesteads with many fewer cattle (one or two) than the average.